Key Takeaways
- Sales enablement KPIs only create value when tied directly to revenue outcomes executives are already accountable for, not when they measure activity for its own sake.
- Activity metrics such as training completion rates and content views are inputs, not KPIs, and they matter only when they shift win rates, ramp time, or deal size.
- Pairing lagging revenue indicators with leading behavioral signals gives enablement leaders both current proof of impact and early warning to course-correct before the quarter ends.
- Presenting the right metric to the right executive, with context and a story behind the number, is as important as tracking the metric in the first place.
What are sales enablement KPIs?
Sales enablement key performance indicators (KPIs) are the metrics that connect enablement programs directly to revenue outcomes, telling sales leaders whether their training, coaching, and content investments are moving the numbers that matter. They differ from activity metrics such as training completion rates or content upload counts, which measure effort rather than impact. In 2026, the most effective enablement teams track a small, deliberate set of KPIs their executive stakeholders already recognize, rather than measuring everything and explaining nothing.
There’s a question every sales enablement leader will eventually face in a room full of executives: What, exactly, are you doing for the business? The leaders who answer it well have something in common. They do not arrive with a list of completed training programs or a slide full of completion rates. They bring numbers executives already recognize, tied directly to deals won, ramp times cut, and quota attained across the team.
This article covers the sales enablement KPIs that build that kind of credibility, how to connect them to the outcomes each executive cares about, and how to use them to run a tighter, more defensible program throughout 2026.
Why Most Sales Enablement Metrics Miss the Point
Most enablement teams measure what is easy to count: courses completed, content uploaded, certifications earned. These are activity metrics, and they are not wrong to track, but they are not KPIs. A key performance indicator must indicate performance, not just activity. The gap between the two is exactly where enablement programs lose credibility with executives.
Consider the difference between tracking the percentage of the team that completed a new product training versus tracking whether win rates improved in the quarter after that training ran. The first number tells you your platform is being used. The second tells you whether it is making a difference. Executives care about the second, and the strongest enablement leaders know how to connect both.
Before tracking any specific KPI, understanding where your program currently sits on the maturity curve helps identify which metrics to prioritize first. The revenue enablement maturity model provides a practical framework for assessing which metrics are most relevant to your current stage and where the highest-leverage improvements sit.
If you want a faster read on where your own program stands, the 2026 Enablement Performance Check scores your platform against ten statements that separate activity tracking from real revenue execution.
What Are the Most Important Sales Enablement KPIs to Track?
The 10 KPIs below form the core of any serious sales enablement measurement program. Each is a revenue-connected metric, and each tells a specific story about how well your people, programs, and content are performing.
For context on structuring both leading and lagging indicators within this list, the guide on productivity leading vs lagging indicators explains how to layer both into a monthly reporting cadence.
|
# |
KPI |
What It Tells You |
|
1 |
Quota Attainment |
Whether enablement is lifting the whole team, not just the top performers |
|
2 |
Distribution of Quota Attainment |
Whether performance is spread healthily or whether a small group is carrying everyone else |
|
3 |
Win and Loss Rates |
How consistently the team wins competitive deals and where losses point to coaching gaps |
|
4 |
Sales Cycle Length |
Where deals are stalling by stage, which surfaces the specific coaching or content intervention needed |
|
5 |
Deal Size |
Whether salespeople are selling value through thorough discovery or discounting their way to a close |
|
6 |
Time to Ramp |
How long it takes new hires to reach full productivity, the most direct measure of onboarding quality |
|
7 |
Employee Attrition |
Whether poor enablement and coaching quality are driving avoidable turnover |
|
8 |
Employee Engagement |
How invested salespeople are in their own development, a leading indicator for retention and performance |
|
9 |
Content Effectiveness |
Which content is being used in deals, which is influencing outcomes, and which is sitting unused |
|
10 |
Customer-Facing Selling Time |
How much of the week salespeople actually spend selling versus administrative tasks and content hunting |
|
|
|
|
1. Quota Attainment
Quota attainment is the top deliverable of any sales enablement program, measuring whether teams hit their revenue targets and whether enablement is lifting the whole team rather than just the top tier.
How to use it:
- Calculate by role: account executives (AEs) measure new revenue closed, account managers measure upsell and renewal, and sales development representatives (SDRs) measure leads converted to qualified opportunities.
- Review monthly and quarterly by seller, by manager, by segment, and by tenure.
- Correlate attainment with coaching and content activity to identify which enablement investments are shifting the number.
2. Distribution of Quota Attainment
A healthy team average can mask a dangerous concentration of performance. This metric tells you whether attainment is broad or whether a small group is carrying everyone else.
How to use it:
- Track the percentage of the team hitting quota each period, not just the average.
- Monitor the percentage earning sales incentive recognition as a proxy for top-tier performance.
- If distribution is narrow and stagnant, the program has not yet succeeded in replicating top-performer behaviors at scale.
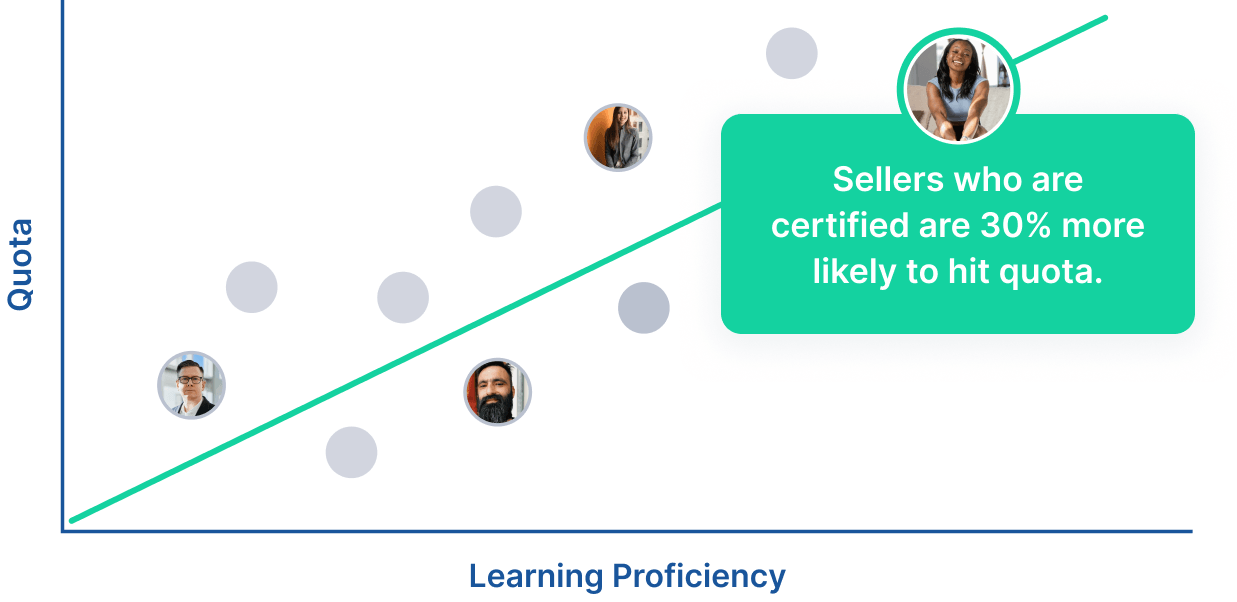
According to a Gartner survey published in September 2024, sellers who feel overwhelmed by the number of skills and tools required are 45% less likely to attain quota. That finding points directly at enablement’s role: when salespeople are not properly equipped, quota distribution suffers before any CRM report confirms it.
3. Win and Loss Rates
Win and loss rates tell you whether salespeople are winning the deals they should be winning and where losses reveal skill or messaging gaps.
How to use it:
- Track by competitor, by manager, and by seller, not just in aggregate.
- Calculate the win rate by dividing wins by total deals closed.
- A healthy aggregate can conceal a region or product line with a serious competitive problem, so segment before drawing any conclusions.
The same Gartner study found that sellers who partner effectively with AI tools are 3.7 times more likely to meet quota than those who do not, with tactical flexibility and the ability to read buyers as the other top predictors. These are the exact capabilities that well-structured role play and coaching programs build, which is why win rate improvement and enablement investment belong in the same conversation.
4. Sales Cycle Length
Sales cycle length measures how long deals take to close and, at the stage level, exactly where they are stalling.
How to use it:
- Track both the aggregate number and the stage-level breakdown.
- A long gap between qualification and proposal is a coaching signal. Consistent drop-off at negotiation is a training and content gap.
- Stage-level data transforms this from a lagging indicator into an actionable coaching list.
5. Deal Size
Deal size reveals whether your salespeople are selling value or selling on price. Thorough discovery leads to bigger deals because the questions asked surface genuine business pain and reduce the pressure to discount. When average deal size trends down, it is almost always a discovery problem before it is a pricing problem.
How to use it:
- Track average deal size alongside average selling price (ASP) as a companion metric.
- If deal size is declining, ask whether salespeople are completing proper discovery before moving to a proposal.
- Targeted coaching on value-based selling is the direct enablement lever to pull.
6. Time to Ramp
Time to ramp measures how long it takes a new hire to reach full productivity and is the most direct proof point for onboarding program quality.
How to use it:
- Measure the aggregate ramp time alongside leading indicators: time to first deal, time to second deal, and off-ramp quota performance in the first 60 days.
- Every week cut from ramp time is another week of productive selling capacity.
SalesHood customers see up to 40% faster time to readiness when structured onboarding is paired with AI coaching practice, according to the State of AI Sales Coaching in Revenue Enablement 2026 report.
|
Copado used SalesHood’s AI-powered onboarding to align teams on new messaging in days rather than weeks and saw win rates, average selling price, and seller participation all improve within 90 days. John Guerriere, Director of Revenue Enablement at Copado, said: “Within 90 days of using SalesHood, we realized improvements in win rates, ASP, and more sellers closing deals.” Read the full story. |
|
7. Employee Attrition
Attrition is expensive and is often a symptom of poor enablement rather than compensation mismatches alone.
How to use it:
- Track voluntary turnover rate alongside coaching frequency and engagement scores.
- Calculate the true cost of attrition by including the opportunity cost of deals not closed while a territory sits vacant or a new hire ramps.
- That number almost always strengthens the investment case for better coaching and development programs.
8. Employee Engagement
Engagement measures how invested salespeople are in their own development and is one of the strongest leading indicators for both retention and performance.
How to use it:
- Measure through a combination of satisfaction surveys, coaching activity by manager, and practice session frequency by salesperson.
- When coaching frequency drops, engagement typically follows, and attrition follows engagement.
- If the salespeople hitting their numbers are also the ones completing the most coaching sessions, that correlation is the ROI argument for investing in coaching infrastructure rather than one-off training events.
9. Content Effectiveness
Content effectiveness tells you which assets are influencing deals and which are sitting unused, and it is the metric that makes the business case for marketing and enablement collaboration.
How to use it:
- Track consumption through views, downloads, and ratings.
- Go further. Compare those signals to revenue data and tie content usage to closed or lost deals.
- Tying content usage to deal outcomes is the most compelling proof point available for any content investment.
10. Customer-Facing Selling Time
The more time salespeople spend in actual selling conversations, the more they will close. Most teams are operating on far less selling time than their leaders assume.
How to use it:
- Combine calendar analysis, CRM activity data, and an annual team survey to estimate how much of the week goes to selling versus admin, internal meetings, and content searching.
- When enablement reduces friction, that time goes directly back into selling.
Leading vs. Lagging Indicators: How to Measure Enablement Before the Quarter Ends
The ten KPIs above are primarily lagging indicators. They tell you what already happened. Win rates, quota attainment, and deal size reflect work done weeks or months earlier, which means by the time they shift, the quarter has often already played out. Relying solely on lagging indicators means you are always reacting rather than adjusting in time to make a difference.
Leading indicators are the behavioral signals that predict those outcomes before they appear in revenue data. The most important ones to track alongside your core KPIs are:
- Practice session completion rates and AI coaching submission frequency, which predict skill readiness before it shows up in win rates.
- Content adoption by new hires in their first 30 days, which predicts ramp time performance before the ramp period ends.
- Manager coaching cadence, meaning how often managers conduct structured coaching sessions, which predicts both team engagement and retention risk.
- Certification completion before a product launch or Sales Kickoff (SKO), which predicts messaging consistency in the next selling cycle.
The most effective enablement leaders track both layers. They report lagging KPIs to executives to demonstrate impact, and they monitor leading indicators internally to course-correct early.
|
The SalesHood State of AI Sales Coaching in Revenue Enablement 2026 report analyzed 34,922 coaching submissions. Top-performing teams averaged seven practice sessions per seller, practiced every three days, and maintained 85% participation rates. Those behavioral signals consistently preceded stronger quota attainment in the quarters that followed. |
How Do You Present Sales Enablement KPIs to the C-Suite?
Tracking the right metrics is half the job. Presenting them in a way that earns executive trust and shapes decisions is the other half. Most enablement leaders present data their executives could have pulled from a dashboard themselves. That is reporting, not communication. The goal is to show the story behind the numbers, connect it to decisions executives face, and make the insight actionable.
Four practices separate the enablement leaders who command the room from those who read from slides.
Know Executive Priorities Before the Meeting
Before walking into any C-suite conversation, understand what each executive is accountable for that quarter:
- A Chief Revenue Officer (CRO) is thinking about quota attainment and ramp time.
- A Chief Marketing Officer (CMO) is thinking about content adoption and pipeline influence.
- A Chief Executive Officer (CEO) wants to see consistency at scale.
Aligning your KPI narrative to the problem each executive is already trying to solve is what makes your update land rather than blend into the noise of their week.
Lead With Real Examples, Not Averages
Averages hide stories. When you say win rates improved 8%, executives nod and move on. When you say the salespeople who completed the new objection-handling module closed 11% more competitive deals than those who did not, you have their attention. As a sales enablement leader, you sit at the intersection of performance data, coaching activity, and content usage. Use that position to surface the specifics that executives would never see from a standard CRM report.
Give Context Behind Every Number
A metric without context is just a number. Before presenting any KPI, prepare the two or three sentences that explain why it moved, what it means, and what should happen next. For example,
- If sales cycle time shortened, was it because a new discovery module improved qualification quality?
- If quota attainment distribution widened, is there a specific manager who needs coaching support?
Executives reward enablement leaders who help them see blind spots, not those who confirm what they already know.
Deliver Insights Concisely and Clearly
Executive attention is finite. If you have three minutes with a CEO, lead with the one metric that connects to their current priority. If pipeline is the conversation, open with the content that is influencing deals this month, not training completion from last quarter.
Prepare one headline number, one supporting detail, and one forward-looking recommendation for every executive conversation. That structure demonstrates both mastery of your data and respect for their time.
Which Sales Enablement KPIs Matter to Each Executive?
Once you understand which KPIs to track and how to tell their story, the final step is knowing which metrics to bring into which room.
Key KPIs for the CRO
The CRO’s core concern is whether the whole team is performing, not just the top tier.
KPIs to bring into the room:
- Quota attainment distribution by seller, manager, segment, and tenure
- Win and loss rates by competitor and by region
- Time to ramp for new hires
- Sales cycle length by stage
What they want to hear: that enablement is compressing the gap between top performers and the rest of the team, not adding programs to manage.
Key KPIs for the CMO
The CMO’s core concern is whether the content their team builds is reaching buyers and influencing deals.
KPIs to bring into the room:
- Content adoption rates by asset and by team
- Content usage correlated to closed and lost deals
- Stage-level conversion rates before and after content initiatives
What they want to hear: that salespeople are using marketing’s content in live selling moments and that you can show which assets are winning deals. Sales content management is the operational discipline that makes that conversation possible.
Key KPIs for the CEO
The CEO’s core concern is consistency: whether every customer conversation reflects the company’s positioning or a version each salesperson has invented independently.
KPIs to bring into the room:
- Messaging consistency scores from pitch challenges or certification programs
- Employee engagement and coaching participation rates
- Quota attainment as a signal of cultural execution, not just individual performance
What they want to hear: that top-performer behaviors are being replicated across the team and that enablement is building a culture of execution. Capture video win stories, run pitch challenges, and share the results directly with your CEO as proof.
Key KPIs for the CFO and CIO
The CFO and CIO’s core concern is return on investment and whether the current tech stack is built to solve revenue problems or just to store information.
KPIs to bring into the room:
- Enablement ROI tied to win rate improvement, ramp time reduction, and sales cycle compression
- Tech stack consolidation: number of overlapping systems and cost per head
- Sales productivity per head quarter over quarter
What they want to hear: that enablement is generating a measurable return and that the platform consolidates training, coaching, content, and analytics rather than adding another disconnected system to the stack.
The CFO and CIO need a consolidation story as much as a performance story. A purpose-built sales enablement platform that unifies training, coaching, content, and analytics in a single data model makes the return on investment case straightforward and the integration story simple. When enablement activity, content usage, and revenue outcomes live in the same system, proving impact to the board becomes a quarterly data pull rather than a weeks-long reconciliation project.
Gravitas, Storytelling, and What Proof Actually Looks Like
Sheevaun Thatcher, a world-class sales enablement leader, says the number one skill sales enablement professionals need is showing up with gravitas. Having gravitas means being someone executives take seriously enough to actually act on your recommendations. People with gravitas command respect because they have taken the time to think carefully about what they are going to say and communicate it in a measured, logical, and confident way.
The best enablement stories combine a metric with a moment. Not just ‘win rates improved 17%’ but ‘win rates improved 17% in the quarter after we built a targeted coaching program around our three most common competitive objections, and here is which salespeople drove that lift and what they did differently.’ That specificity is what moves a conversation from data presentation to strategic influence.
StarCompliance demonstrates exactly this kind of measurable impact. By using SalesHood’s training, onboarding, and AI coaching programs, they doubled their average selling price, increased new logo win rates by 17%, and reduced sales cycle length by 35%.
|
Craig Jones, Chief Revenue Officer at StarCompliance, said: “SalesHood streamlines our sales process and aligns our teams on messaging, leading to measurable improvements in our performance. The ability to double our average selling price and reduce our sales cycles by 35% has been a game changer.” |
How AI Is Changing the Way Teams Measure Enablement in 2026
One of the persistent challenges of measuring sales enablement has been the lag between an investment and its visible impact. A coaching program runs in January, and the hope is that it shows up in win rates by Q2. The feedback loop has historically been too slow to allow meaningful adjustments while the selling motion is still in progress.
Agentic AI changes that feedback loop. When every practice submission is automatically scored and every coaching session is tracked in real time, leading indicators become available immediately rather than quarterly. Sales coaching metrics, specifically practice frequency, feedback quality scores, and skill improvement trends, are becoming as important to track as traditional lagging KPIs.
For a broader look at how modern tooling is reshaping measurement workflows, the guide to AI sales tools covers the capabilities producing the most measurable results in 2026.
Teams that build these signals into their measurement framework have both the early warnings and the executive-ready proof points they need to manage programs with precision.
|
Companies implementing AI coaching report programs launching three times faster, salesperson participation increasing 45%, and skill improvement of up to 38% after just four practice sessions, according to SalesHood’s AI coaching research. Those are the kinds of numbers that belong in an executive update alongside your lagging KPIs, not instead of them. |
The KPIs That Matter Start With the Questions You Ask
Every sales enablement strategy meeting should start with a review of the metrics. Have the data ready and be prepared to look at attainment and productivity results by team, by manager, and by segment. Come prepared with a view that everyone can review and discuss together. Mastering this data and making it part of the regular leadership cadence is what elevates enablement from a support function to a strategic one.
The thread connecting every KPI in this guide is the same: sales enablement metrics only create value when tied to outcomes executives are already accountable for. Pick the small set that maps to your organization’s priorities, build the habit of reviewing them with your leadership team, and make the story behind the numbers as compelling as the numbers themselves.
SalesHood’s Impact Insights analytics layer connects enablement activity directly to pipeline, win rates, ramp time, and quota attainment, giving teams the proof points they need without manually reconciling data across multiple disconnected systems.
If you are ready to move from activity reporting to revenue-connected measurement, book a demo to see how other sales leaders are making that case today.
Frequently Asked Questions (FAQs)
What are sales enablement KPIs?
Sales enablement KPIs are performance metrics that tie enablement efforts to business goals like improved selling performance, win rates, and content adoption. They show whether training, content, coaching, and tools are helping reps be more successful over time.
What is the difference between a sales enablement KPI and a sales enablement metric?
A sales enablement metric is any number that can be measured within an enablement program, including training completion rates, content views, and certification pass rates. A KPI is a subset of metrics directly connected to a key business outcome. All KPIs are metrics, but not all metrics qualify as KPIs. Reporting activity metrics to the C-suite without connecting them to revenue outcomes is how enablement programs lose credibility with leadership.
How do I choose the right sales enablement KPIs for my team?
Choose KPIs that align with business priorities and clearly show how enablement activities support revenue goals. Focus on a small set of meaningful, measurable metrics tied to performance outcomes rather than tracking every available number.
How should sales enablement present KPIs to leadership?
Present KPIs by linking them directly to business outcomes, using context and storytelling. Focus on strategic metrics that leaders care about (e.g., win rates, cycle time, productivity), and show trends over time to demonstrate progress and areas for investment.